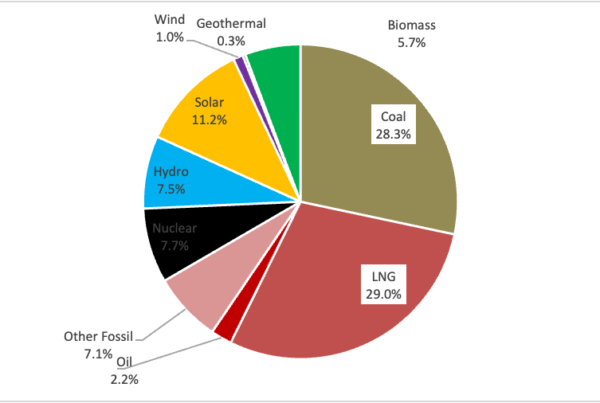
The share of electricity generated from renewable energy sources in Japan exceeded 20%, with solar power accounting for 8.5%.
Summary
- In 2020, renewables are estimated to account for 20.8% of all electricity generated in Japan (including self-consumption), up from 18.5% in the previous year.
- The share of annual electricity generated by PV in Japan increased to 8.5% in 2020 from 7.4% in the previous year, while the share of VRE (variable renewables: solar and wind) increased to 9.4% from 8.2%.
- The annual amount of electricity generated by biomass power (3.2%) increased by about 20% from the previous year, wind power (0.86%) also increased by about 10%, and geothermal (0.25%) and hydroelectric (7.9%) power also increased slightly from the previous year.
- The share of annual electricity generated by fossil-fueled thermal power remained at a high level of 74.9%, unchanged from the previous year, while the share of coal (27.6%) and LNG (35.4%) showed a downward trend. Nuclear power decreased to 4.3% from 6.5% in the previous year.
- In Europe, the annual share of electricity generated from renewables already exceeds 40% in many countries, with the European average reaching 38.6%, surpassing the 37.3% share of electricity generated from fossil fuels for the first time. The share of VRE (variable renewables) also exceeds 20% in many countries, including 55% in Denmark.
- In 2020, electricity supply and demand data, the share of renewables exceeded 30% of annual electricity demand in the Hokuriku, Tohoku, and Shikoku areas; the one-hour maximum reached nearly 70% for Japan as a whole, with a maximum of 57% for VRE. At the one-hour maximum, renewables accounted for more than 100 percent of electricity demand in the Shikoku, Tohoku and Kyushu areas.
Share of renewable energy to total electricity generated in Japan
ISEP estimated[1] the share of total electricity generated in Japan in 2020 (including self-consumption) by power source based on electricity survey statistics[2] and nationwide electricity supply and demand data. As a result, in 2020 (calendar year), renewables will account for 20.8% of all electricity generated in Japan, up approximately 2 percentage points from 18.5% in 2019 (Table 1, Figure 1).
This means that the share of renewables has reached more than 20%, up from about 12% in 2014, with an increase of about one percentage point each year (Figure 2). Among them, the amount of electricity generated by solar power has increased from 7.4% in the previous year (2019) to 8.5%, and has already achieved the target ratio (7%) assumed in the power source composition for FY2030 in the Fifth Basic Energy Plan (approved by the Cabinet in July 2018). When combined with the 0.86% share of wind power, the share of VRE (variable renewables) increased to 9.4% from 8.2% in the previous year (2019). As for renewables other than solar power, biomass power (3.2%) and wind power (0.86%) increased by about 20% and 10%, respectively, from the previous year, while geothermal (0.25%) and hydropower (7.9%) also increased slightly from the previous year.
By month, the share of renewables was highest in May, reaching 29.8% (Figure 3). In May of this year, the share of hydropower was also higher than usual at 11.5% due to the amount of water flowing out, the share of solar power was higher at 13.6%, and the share of variable renewables (VRE) reached 14.5% (compared to 12.4% the previous year).
For wind power generation, we used the power transmission volume from the power supply and demand data published by the power companies, rather than the data from the electricity survey statistics (power transmission volume and power reception volume by electric utilities). For the amount of electricity generated by photovoltaic power generation, the data from the electricity survey statistics was used, but it should be noted that there is a range of estimates for the share of photovoltaic power generation because the annual transmission volume is about 10% larger than the electricity supply and demand data. Specifically, in the electricity survey statistics, the annual amount of electricity generated by PV was 85.1 TWh, while the amount transmitted using electricity supply and demand data was 70.2 TWh. Since the estimate for residential solar power (less than 10 kW) is 3.5 TWh, combined with that, the figure is 73.7 TWh, which is about 10% smaller, so the share of solar power is 7.5%. Estimates of the amount of electricity generated from electricity survey statistics are based on the sum of actual electricity generation reported by electric utility companies (retail electric companies and power generation companies above a certain size) and the amount of electricity received from companies other than electric utilities, so it is possible that the figures are larger due to double counting.
Fossil thermal power generation is on a downward trend, decreasing from 75.0% in 2016 to 74.9% in 2020, a decrease of about 13 percentage points from 2014 but still at a high level. For coal-fired power, the share has decreased from 30.2% in 2016 to 27.6% in 2020, and for LNG, the share is also on a downward trend, from 38.9% in 2016 to 35.4% in 2020. Nuclear power, on the other hand, has been increasing its share of electricity generated every year since 2015, after being reduced to zero in 2014, but in 2020 it will account for 4.3%, down from 6.5% the previous year, and at a level only half as high as the 8.5% share of electricity generated by solar power.
Table 1: Renewable Energy as a Share of Total Power Generation in Japan
(Source: made by ISEP based on power supply survey statistics of METI, etc.)
| Power supply | 2014 | 2015 | 2016 | 2017 | 2018 | 2019 | 2020 | Remarks |
| Hydro | 8.0% | 8.6% | 7.6% | 7.6% | 7.8% | 7.4% | 7.9% | Including large hydro |
| biomass | 1.5% | 1.5% | 1.9% | 2.0% | 2.2% | 2.7% | 3,2% | Including self-consumption |
| Geothermal | 0.24% | 0.25% | 0.22% | 0.21% | 0.22% | 0.24% | 0.25% | |
| Wind | 0.47% | 0.50% | 0.54% | 0.61% | 0.69% | 0.76% | 0.86% | |
| PV | 1.9% | 3.0% | 4.4% | 5.7%. | 6.5% | 7.4% | 8.5%. | Including self-consumption |
| Renewable energy | 12.1% | 13.8% | 14.7% | 16.4% | 17.4% | 18.5% | 20.8% | |
| VRE | 2.3% | 3.5% | 5.0% | 6.3% | 7.2% | 8.2% | 9.4% | |
| Fossil power | 87.9% | 85.7% | 83.6% | 80.8% | 77.9% | 75.0% | 74.9% | Including Coal, LNG, oil, etc. |
| Coal | 30.2% | 30.2% | 28.2% | 27.8% | 27.6% | |||
| LNG | 38.9% | 38.4% | 37.4% | 36.0% | 35.4% | |||
| Nuclear | 0.0% | 0.4% | 1.7%. | 2.8% | 4.7% | 6.5% | 4.3% |
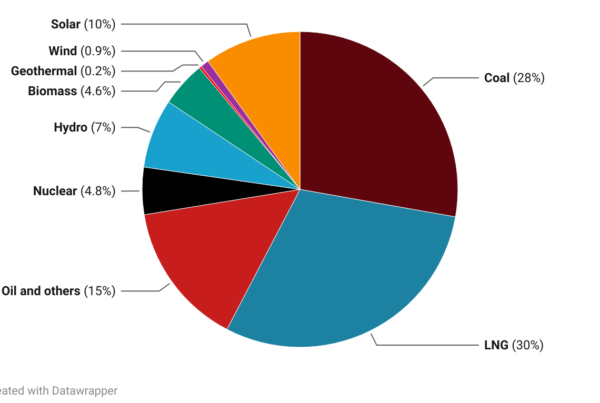
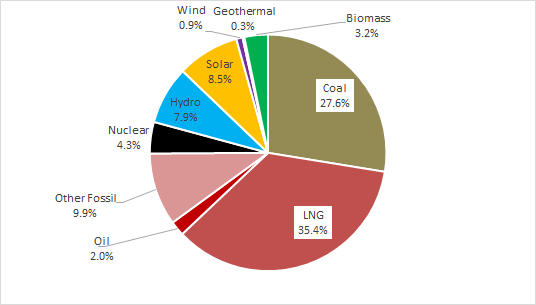 Figure 1: Power supply composition of Japan as a whole (preliminary data for 2020)
Source: made by ISEP, based on electricity survey statistics of METI, etc.
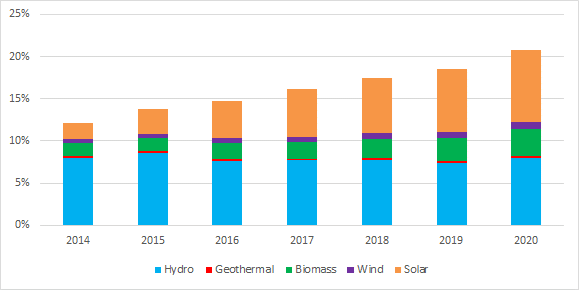 Figure 2: Renewable energy as a share of total electricity generated in Japan
(Source: made by ISEP from electricity survey statistics of METI, etc.)
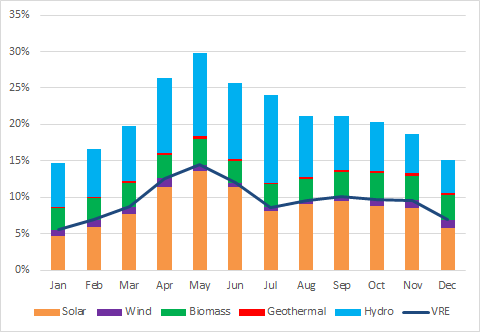 Figure 3: Monthly share of renewables in total electricity generated in Japan (2020)
(Source: made by ISEP from electricity survey statistics of METI, etc.)
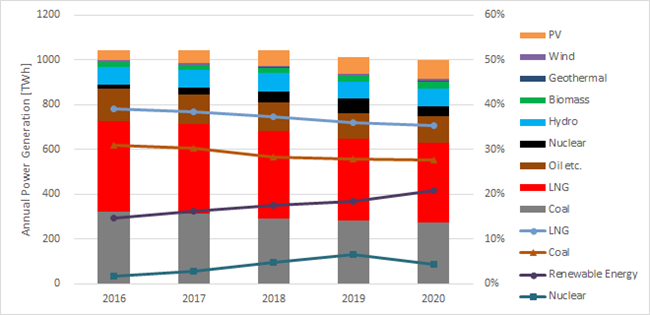 Figure 4: Trends in annual electricity generation and power supply composition in Japan
(Source: ISEP, based on electricity survey statistics, etc.)
Comparison of the share of renewable energy with other countries
Since the 1990s, the European Union (EU) has been the world leader in the installation of renewable energy into the electricity sector, with the share of renewable energy in all 28 European countries (including the UK) exceeding 30% in 2017 and reaching about 38.6% in 2020, surpassing the 37.3% share of electricity generated from fossil fuels for the first time. This is the first time that the share of electricity generated from fossil fuels has exceeded[3]. This is nearly double the share of renewable electricity in Japan. The share of variable renewables (VRE), such as solar and wind power, is also 20.5% in Europe, more than double the 9.4% in Japan.
The breakdown of the share of annual electricity generated by renewables in 2020 for major European countries is shown in Figure 5. This figure is based on the latest data for 2020 on the electricity sector in 28 European countries, as estimated by the German think tank Agora Energiewende. In Austria, the share of hydropower is more than 60%, and together with 10% wind and 6% biomass, the share of renewables is nearly 80%. In Denmark, where the share of variable renewables (wind and solar) VRE has already reached 55%, the share of renewables in annual electricity generation is about 76%. The share of VRE has also reached 20% in Europe as a whole, but is over 30% in Germany, and close to 30% in the UK and Spain. The ratio of VRE has also reached 20% in Europe as a whole, while in Germany it is over 30% and in the UK and Spain it is close to 30%. On the other hand, in France, where the share of nuclear power is nearly 70%, the share of renewables is about 20%, the same level as in Japan, and the VRE ratio is only 10%. As for countries with a high share of biomass power generation, Denmark and the United Kingdom have about 17% and 12%, respectively, but they are on a declining trend, and the EU Directive (RED II) for 2030 has stricter sustainability standards for biomass.
In response to the Paris Agreement launched in 2020, the EU as a whole developed a Climate Change and Energy Framework in 2014 to reduce greenhouse gas emissions by 40% by 2030 (compared to 1990 levels), and took a policy decision in 2018 to set a target of at least 32% for the share of renewables (final energy consumption) by 2030 and a target of 32.5% for energy efficiency improvements[4]. The EU has declared that it will reduce greenhouse gas emissions to virtually zero by 2050 in order to become climate-neutral, and is considering raising its reduction target for 2030 to 55% or higher[5]. The EU is also considering raising its reduction target for 2030 to 55% or more. Each EU country has formulated Energy and Climate Change Plans (NECPs) for the period from 2021 to 2030[6]. In addition, the EU Commission has announced the European Green Deal in December 2019[7].
Comparing the share of renewables in annual electricity generation in European countries and Japan from the 1990s to 2020, we can see that European countries have been steadily increasing their share of renewables since the 1990s in preparation for 2020. Denmark, for example, was already at 17% in 2000, exceeded 30% in 2010, reached 75% in 2020, and aims to exceed 100% by 2030 (Figure 6). Germany’s share was around 7% in 2000, but later increased to nearly 20% in 2010, reaching 45% in 2020, with the goal of over 65% by 2030 and over 80% by 2050. Germany has increased its share more than sevenfold, from just 6% in 2000 to 44% in 2020 (Figure 7)[8]. On the other hand, the share of nuclear power plants has dropped from 29% to 11%, steadily decreasing toward 2022, when the country will have no nuclear power plants. The share of coal, including lignite, produced in Germany, which accounted for 50% in 2000, declined to 23.4% in 2020, the same level as wind power’s 23.4%, due to factors such as higher carbon prices under the Emissions Trading Scheme (EU ETS).
In China, where the installation of wind and solar power in addition to hydropower has progressed rapidly over the past decade, wind power will account for 6.1% of annual electricity generation in 2020, and solar power 3.4%, with the VRE ratio already reaching 9.5%[9]. Renewable energy, including hydropower, will account for 28.5% of total electricity generated.
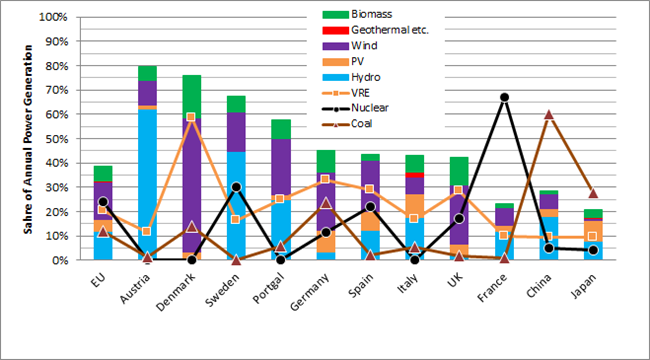 Figure 5: Comparison of the share of electricity generated by renewables and other energy sources in European countries, China, and Japan (2020)
Source: ISEP, based on data from Agora Energiewende, China Energy Potal, electricity survey statistics, etc.
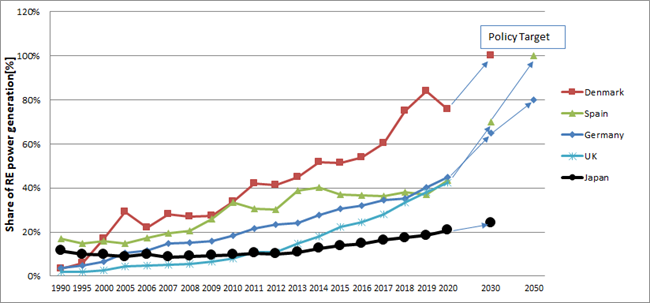 Figure 6: Renewable electricity deployment results and targets for European countries and Japan
(Source: made by ISEP from EU Statistics Office, Agora Energiewende data, etc.)
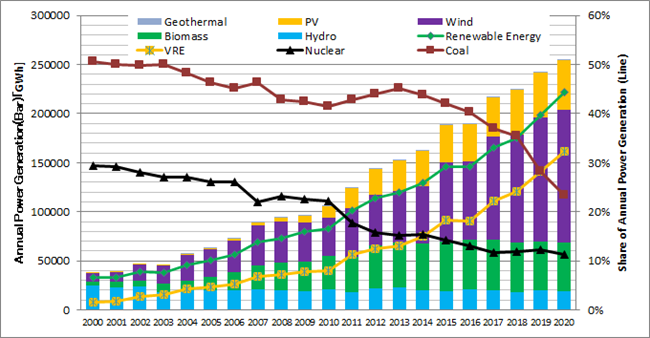 Figure 7: Trends of amount of electricity generated by renewables and share of power generation in Germany
(Source: mode by ISEP from AGEB data)
Share of renewable energy in Japan’s electricity supply and demand
Based on the electricity supply and demand data published monthly by 10 TSOs for each area in Japan, we have compiled data for the year 2020 (calendar year), focusing on the ratio of renewable energy to grid electricity demand. ISEP’s Energy Chart provides an interactive and easy-to-understand analysis of electricity supply and demand data in Japan using a variety of graphs from published data[10].
The ratio of renewables in Japan’s total annual electricity demand averaged 19.1% in 2020 (calendar year), a significant increase from the 17.1% annual average in 2019 (calendar year). Solar PV and hydropower both accounted for the largest share of the total, at 8.1%. Solar power increased from 7.2% in the previous year, and hydropower also increased from 7.6% in the previous year. Biomass power also increased to 1.6% from 1.2% the previous year, and wind power also increased to 1.0% from 0.9%. By way of comparison, in fiscal 2016, renewables accounted for 13.8% of the total, while solar power was still only 4.4%. On the other hand, the share of nuclear power in 2020 was 5.0%, a significant decrease from 7.4% the previous year.
The monthly average of the share of renewables to electricity demand in Japan as a whole was highest in May 2020, at 27.5%, a significant increase from 24.2% in the previous year (Figure 8). Among these, the share of VRE (variable renewables) was 13.7%, up from 12.6% in the previous year. The daily average reached 34.0% on May 2nd and 4th, 2020, with the largest VRE share of 20.1% on May 2nd, up from a maximum of 17.8% the previous year. The one-hour peak was 69.6% in the 11:00-12:00 period on May 4th, when solar power accounted for 56.4% of the total, and together with wind power at 1.1%, the VRE peak was 57.4%. This is a significant increase from the previous year’s peak of 50.6% for solar power. Incidentally, wind power peaked at 3.3% in the early morning hours of November 9th, 2020.
By TSOs area, the Hokuriku Area had the highest average share of renewables in annual electricity demand in 2020 at 35.2%, but hydropower accounted for a large share of 28.0% compared to 4.4% for solar and 0.8% for wind (Figure 9 ). Even in the Tohoku area, which has the second largest share of renewables, the share will reach 34.0% in 2020, with solar power increasing to 9.0% from 8.3% the previous year. The share of wind power is also 4.3%, up from 3.4% in the previous year, and is as high as that of Hokkaido in Japan. The share of biomass power generation was also high at 4.5%, and geothermal power generation accounted for 1.3%.
The average share of renewable energy in East Japan is 17.7%, which is lower than the national average of Japan. This is due in large part to the fact that the TEPCO(Tokyo) area accounts for only 12.3%. In this TEPCO(Tokyo) area, solar power accounted for 6.2%, higher than the 4.7% of hydro power. In the Hokkaido area, the share of renewable energy was 23.9%, but the share of wind power was also high, reaching 4.0% compared to 8.0% for solar power.
The share of renewables in Central and western Japan as a whole was 20.2%, higher than the national average of 19.1%, but the share of VRE was higher at 9.7%, including 9.1% solar and 0.6% wind. On the other hand, nuclear power plants, which are operating at zero in eastern Japan, and in the Kansai area and Kyushu area in central and western Japan, accounted for 9.1% of the total, the same as solar power, but down from 13.5% the previous year. In the Shikoku area, which has the third largest share of renewables, the share was 30.8%, up considerably from 24.8% the previous year, but the share of nuclear power was zero. The share of VRE, which combines 13.2% solar and 1.8% wind, reached 15.1%, the highest level among all areas in Japan, up from 12.7% the previous year. In the Kyushu area, which has the highest share of solar power in the country, the share of renewable energy was 26.3%, a significant increase from 23.0% the previous year. In the Kyushu area in particular, solar power accounted for 14.3% compared to 5.6% for hydropower, and together with wind power at 0.8%, the share of variable renewables (VRE) was 15.1%, the highest level in Japan along with the Shikoku area.
In the previous year, 2019, there was no area where renewables exceeded 100% in the one-hour peak value, but in 2020, there were time periods where renewables exceeded 100% at Shikoku, Tohoku, and Kyushu area. At Shikoku area, the ratio of renewables to electricity demand reached 113.7% at 11:00 a.m. on October 25, 2020 (Figure 10). During this peak period, the share of VRE was 86.7% with 84.5% from solar power and 2.2% from wind power. In the Tohoku area, the ratio of renewable energy reached a maximum of 108.8% during the peak hour (11:00 a.m. on May 5th, 2020). At this time, the VRE ratio reached 78.3%, with 72.8% from solar and 5.5% from wind.
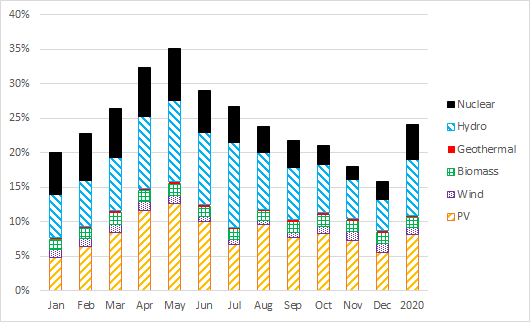 Figure 8: Share of renewables and nuclear power in Japan’s electricity supply by month (2020)
Source: made by ISEP from electricity supply and demand data of TSOs
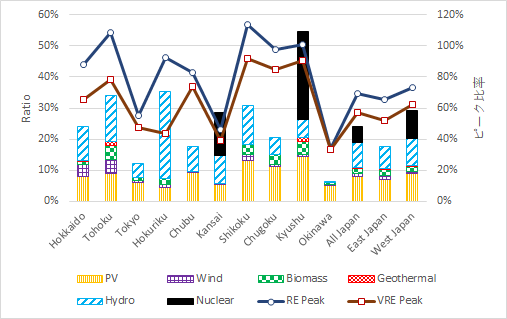 Figure 9: Share of renewables in electricity supply by area (2020)
Source: mode by ISEP from electricity supply and demand data of TSOs
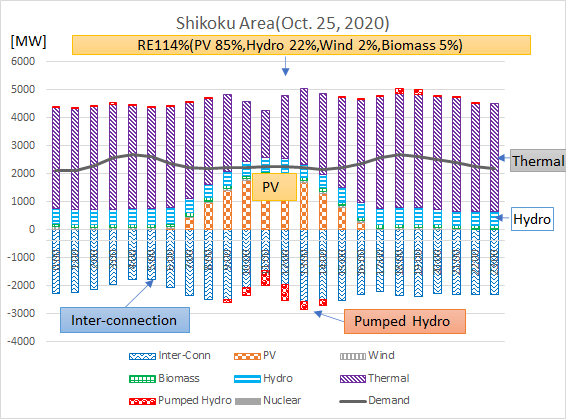 Figure 10: Electricity Supply and Demand in Shikoku Electric Power Area (October 25, 2020)
Source: made by ISEP from electricity supply and demand data of Shikoku Electric Power Co.
[1] Estimates use the previous year’s figures for private power generation and residential solar consumption estimates from October 2020 onward, but the impact is expected to be small.
[2] Electricity Survey Statistics(METI) http://www.enecho.meti.go.jp/statistics/electric_power/ep002/
[3] Agora Energiewende “The European Power Sector in 2020” https://www.agora-energiewende.de/en/
[4] EU Commission, “2030 Climate & Energy Framework”.
[5] EU Commission, “2050 long-term strategy” https://ec.europa.eu/clima/policies/strategies/2050_en
[6] EU Commission, “National energy and climate plans (NECPs)” https://ec.europa.eu/energy/topics/energy-strategy/national-energy-climate-plans_en
[7] EU Commission, “A European Green Deal.”
[8] AGEB “STORMMIX 1990-2020” https://ag-energiebilanzen.de/
[9] China Energy Portal https://chinaenergyportal.org/en/
[10] ISEP Energy Chart https://isep-energychart.com/en/

